How to View Page as Googlebot (Rendered DOM, Resources & Crawl View)
Google does not experience the web the same way a human user does. While modern search engines have become adept at rendering JavaScript, there is often a significant gap between what you see in your browser and what Googlebot actually processes and indexes.
If your “money” content or internal links are hidden from the crawler, they don’t exist in the eyes of the Search engine. In this guide, I will show you how to use the “Source of Truth” tools to audit your site’s rendering and ensure your technical SEO foundation is solid.
Start with the Source of Truth: What Google Actually Fetched
The most reliable way to see what Google sees is to ask Google directly. Tools that simulate a bot are useful, but Google’s internal rendering engine (Evergreen Googlebot) is the final authority.
URL Inspection (Live Test) in Google Search Console
The URL Inspection tool is your primary diagnostic instrument. Do not rely on the “Indexed” version of the page, as that data may be weeks old. Instead, click Test Live URL.
- View Crawled Page: Once the test is complete, click “View Tested Page.” This opens a sidebar containing the rendered HTML.
- The Screenshot Tab: This provides a visual representation of the page layout. Use this to identify if critical elements (like hero text or CTA buttons) are failing to render.
- The More Info Tab: This is where you find the HTTP response code (e.g., 200 OK), any console errors generated during rendering, and a list of resources (JS/CSS) that Googlebot couldn’t load.
Test Public URLs with the Rich Results Test
If you don’t have Google Search Console access for a specific domain, the Rich Results Test serves as an excellent proxy.
- Enter your URL and select the “Smartphone” agent.
- After the analysis, click “View Tested Page.”
- Review the HTML tab to see the code Google uses for parsing.
🔖 Read more: Google’s Official Rendering Documentation
View the Page as Googlebot Using Chrome
Sometimes you need a fast, local check without waiting for a Google tool to queue your request. You can turn your own browser into a Googlebot simulator.
Override User-Agent in Google Chrome DevTools
The User-Agent (UA) tells the server what kind of device is requesting the page. By changing your UA to Googlebot’s, you can see if the server is serving different HTML to bots (a practice that can lead to cloaking issues if not handled correctly).
-
Open Chrome DevTools (
F12orCmd+Opt+I).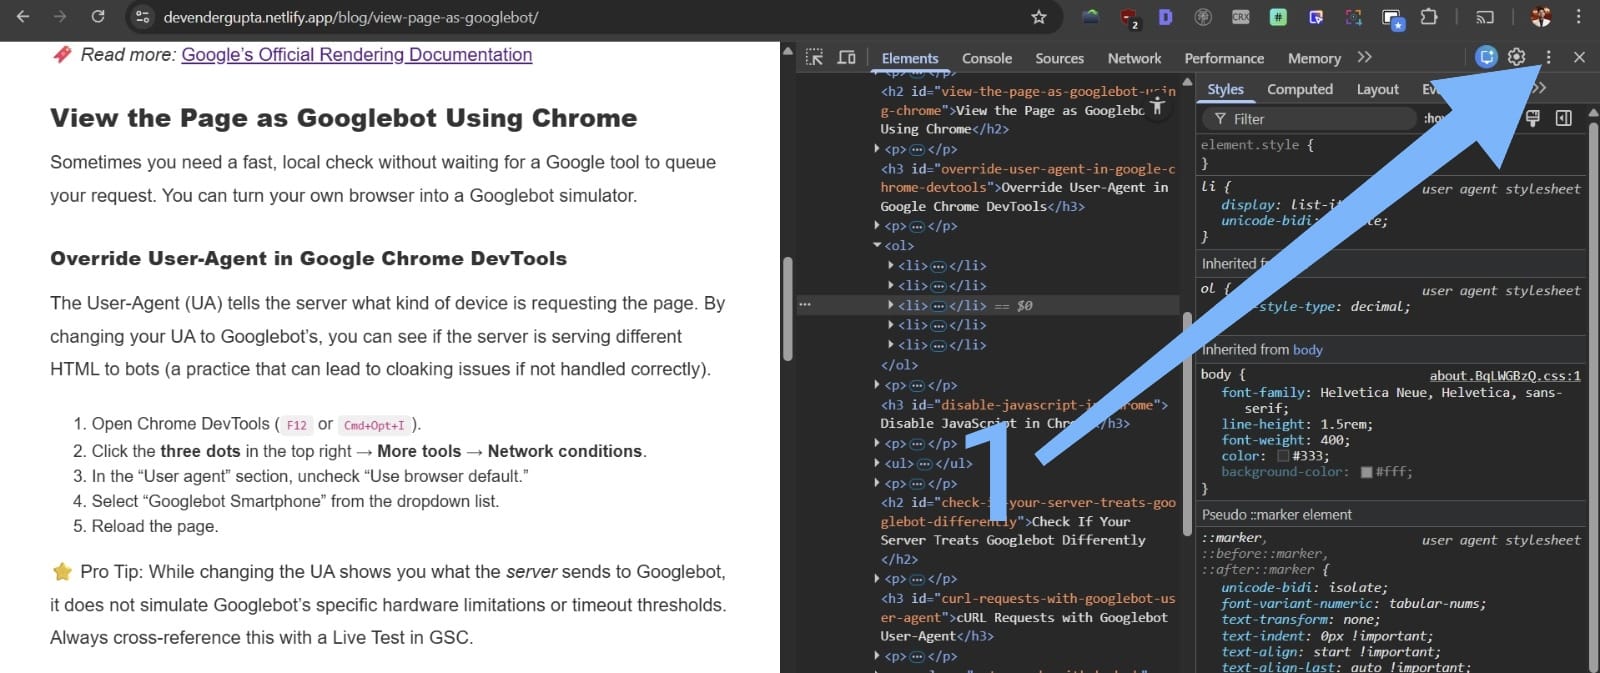
-
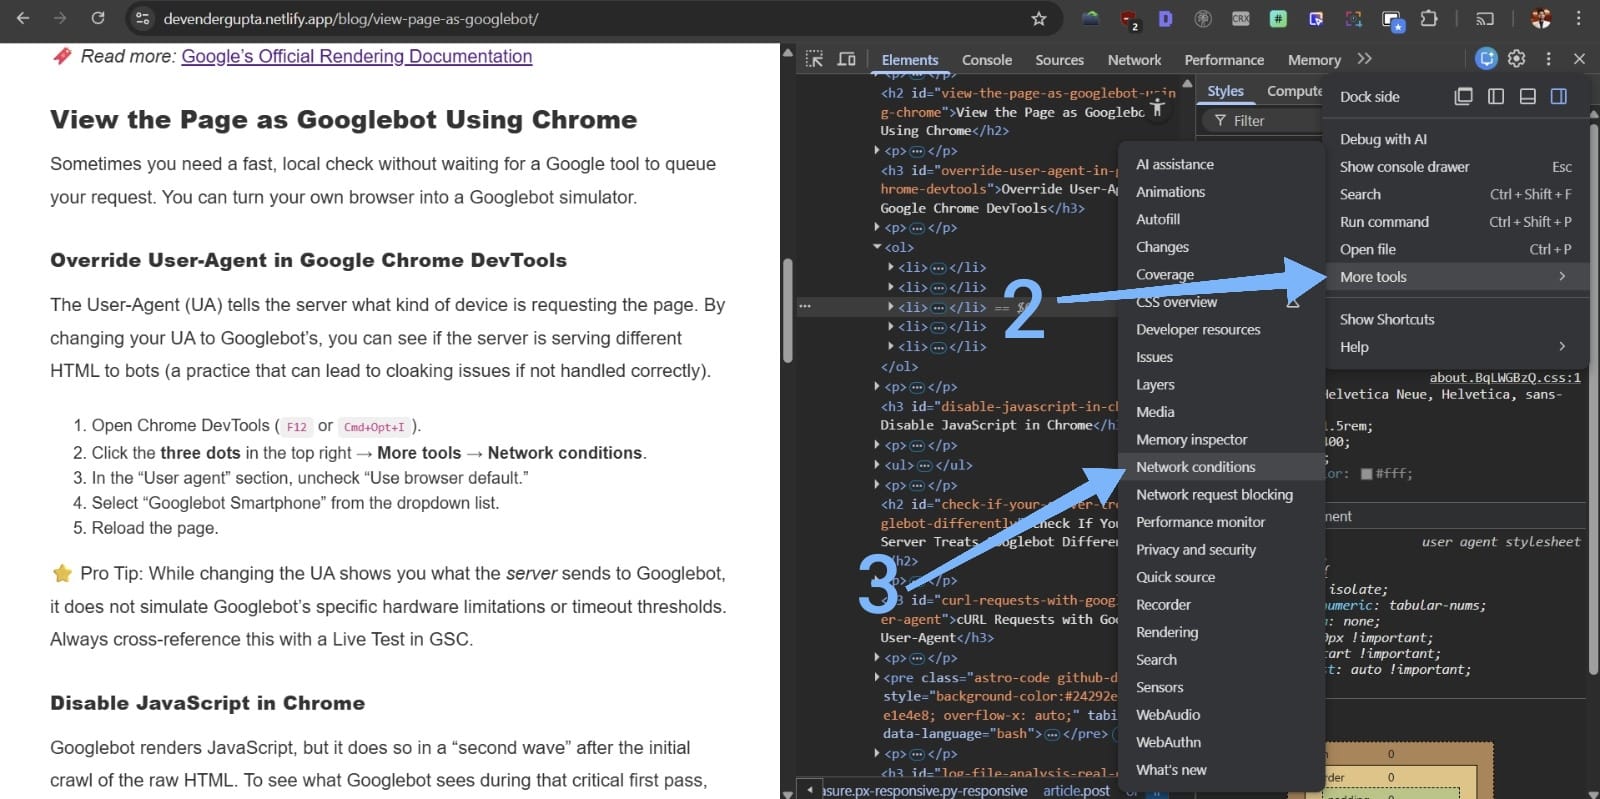
Click the three dots in the top right → More tools → Network conditions.
-
In the “User agent” section, uncheck “Use browser default.”
-
Select “Googlebot Smartphone” from the dropdown list.
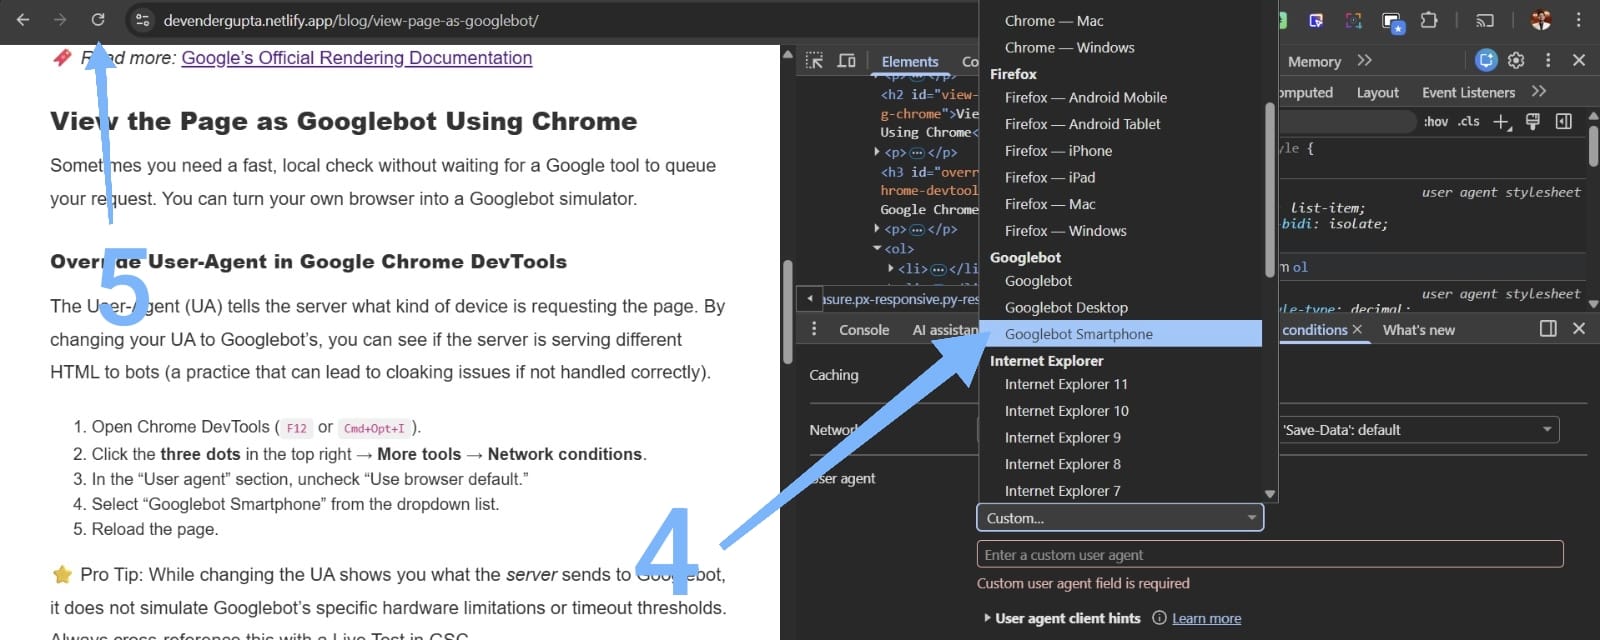
- Reload the page.
⭐ Pro Tip: While changing the UA shows you what the server sends to Googlebot, it does not simulate Googlebot’s specific hardware limitations or timeout thresholds. Always cross-reference this with a Live Test in GSC.
Disable JavaScript in Chrome
Googlebot renders JavaScript, but it does so in a “second wave” after the initial crawl of the raw HTML. To see what Googlebot sees during that critical first pass, you must disable JavaScript.
- In DevTools, press
Cmd+Shift+P(Mac) orCtrl+Shift+P(Windows). - Type “Disable JavaScript” and hit Enter.
- Reload the page.
If your main navigation or content disappears, you are relying entirely on Client-Side Rendering (CSR). This can delay indexing and put your site at a competitive disadvantage.
Check If Your Server Treats Googlebot Differently
Occasionally, firewalls or CDNs (like Cloudflare) may inadvertently block Googlebot, or developers might implement “Dynamic Rendering” incorrectly.
cURL Requests with Googlebot User-Agent
Using the command line allows you to bypass browser caching and see the raw headers and body. Use the following command to request a page as Googlebot:
curl -A "Mozilla/5.0 (compatible; Googlebot/2.1; +http://www.google.com/bot.html)" -I https://myshop-online.com/This command fetches only the headers (-I). Check the Status code. If you see a 403 Forbidden or 401 Unauthorized while the browser shows a 200 OK, your server is blocking Googlebot.
Log File Analysis (Real Googlebot Behavior)
Log files are the only way to prove what Googlebot truly did in the past. Look for entries where the User-Agent matches Googlebot and validate the IP address.
⭐ Pro Tip: Anyone can fake a User-Agent. To ensure a request is actually from Google, you must perform a reverse DNS lookup. A legitimate Googlebot request will always resolve to googlebot.com or google.com.
Diagnose Rendering Problems That Hide Content
When viewing the page as a bot, your goal is to identify discrepancies between the Initial HTML (the source) and the Rendered DOM (the final state).
Compare View Source vs. Inspect Element
- View Source (
Ctrl+U): This is the raw HTML sent from the server. - Inspect Element: This is the current state of the DOM after JavaScript has executed.
If your Structured Data (JSON-LD) is injected via a Tag Manager and only appears in “Inspect Element,” ensure Googlebot isn’t hitting a timeout before that script executes.
{
  "@context": "https://schema.org",
  "@type": "WebPage",
  "name": "How to View Page as Googlebot",
  "publisher": {
    "@type": "Organization",
    "name": "SEO Authority"
  }
}
Validate Resource Loading
In the GSC Live Test, look specifically for “Blocked Resources.” If your robots.txt file disallows Googlebot from crawling your CSS or essential JS folders (like /static/js/), Googlebot will not be able to render the page correctly. It will see a broken, unstyled version of your site, which can negatively impact your mobile-friendly score.
A Practical Diagnostic Flow SEOs Can Follow
To effectively audit your site, follow this sequence:
- Run a Live URL Inspection: Confirm if Google can fetch and render the page.
- Compare HTML: Check the “View Tested Page” HTML against your browser’s “View Source.”
- Toggle JavaScript: Disable JS in Chrome to see the “First Wave” content.
- Use Chrome UA Override: Check for server-side bot-targeting or cloaking.
- Check robots.txt: Ensure
/scripts/or/styles/are not blocked. - Verify via Logs: Confirm that Googlebot is hitting the URL with a
200 OKstatus.
By consistently viewing your site through these lenses, you ensure that no technical barriers stand between your content and Google’s index.